 final results
Abstract
This work is carried out as a PhD. application assign ment with a duration of 10 days. The task is to identify and sort possible outlier intervals from a multivariate time series weather dataset. We use a K-nearest neighbour based method to search for anomalous data points in the data. We then create intervals between the sampled points using the sliding window technique. An approximation to Kullback-Leibler divergence (KL) is used to quantify the degree of di-vergence between two Gaussian distributions (the generated interval distribution and the distribution of the remaining data). At the end, a list of the top intervals is generated to rank the anomalies based on their scores. The results show that the algorithm is able to detect numerous outlier intervals. However, due to the lack of labeled data, we could not numerically evaluate the performance of the algorithm.
Dataset
To evaluate the methodology, we conduct experiments with real-world multivariate time series data recorded from ocean observing buoys provided by the National Data Buoy Center (NDBC). The dataset covers six months of hourly data, beginning in June 2012 and ending in November of the same year. This period corresponds to the Atlantic hurricane season, which was particularly active this year with 19 tropical cyclones. 10 of them became hurricanes (winds over 64 km/h). This information can help to interpret and evaluate the results by matching the extracted interval with the already known time window of hurricanes since the dataset does not provide ground-truth data. Due to the limited time, we skip the matching. The variables provided are measurements of significant wave height Hs, wind speed W, and sea level pressure P. The data were collected at a site near the Bahamas in the Atlantic Ocean 1 (23.866° N, 68.481° W).
Results
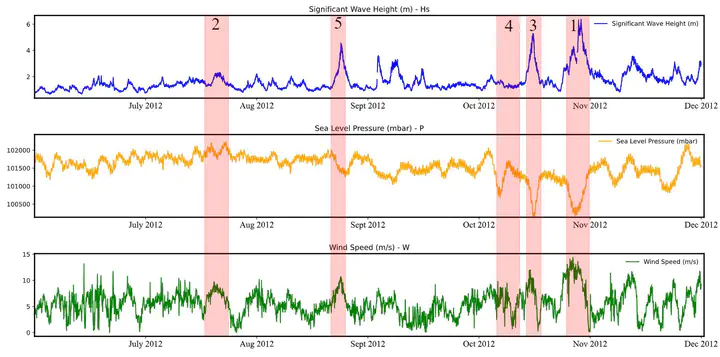
The above figure illustrates the results of applying the KL al- gorithm based on generated intervals containing pointwise outliers. The figure shows three time series curves represent- ing the features of the data set. The red color highlights the area where the outlier intervals are detected. The numbers at the top indicate the order of the intervals based on their intensity. Number 1 has the highest intensity. The results show that the algorithm is able to detect numerous outlier intervals, most of which could be identified by eye. Others, like interval number 4 are hard to identify directly. However, we could not confirm the results due to the lack of labeled data.
For the detailed information about the utilized methods, please refer to my GitHub repository to view the source code or to the attached report file.